Many applications today require high-speed sampling analog-to-digital converters (ADCs) with 12-bit or higher resolutions for users to make more accurate system measurements. Unfortunately, higher resolution also means the system is more sensitive to noise. Each time the system resolution is increased by one bit, for example from 12 to 13 bits, the system's sensitivity to noise is doubled. Therefore, for ADC design, designers must consider a source of noise that is often forgotten – system power. The ADC is a sensitive device and should be treated equally for all inputs such as analog, clock and power supplies in order to achieve the best rated performance described in the data sheet. There are many sources of noise and various forms, and noise radiation can affect performance.
The buzz concept in today's electronics industry is that new designs are “green†while reducing costs. Specific to portable applications, it requires reduced power consumption, simplified thermal management, maximum power efficiency, and extended battery life. However, most ADC data sheets recommend using a linear power supply because its noise is lower than that of a switching power supply. This may be true in some cases, but new technological advances have proven that switching power supplies can also be used in communications and medical applications.
This article describes the various test and measurement methods that are critical to understanding high-speed ADC power supply designs. In order to determine the sensitivity of the converter to the effects of the supply rail noise and to determine what level of noise the supply rail must be in order for the ADC to achieve the desired performance, two tests are useful: commonly referred to as the power supply rejection ratio (PSRR) and power supply modulation ratio. (PSMR).
What is power suppression?
When there is noise on the power rail, there are two main factors that determine the performance of the ADC. They are PSRR-dc, PSRR-ac, and PSMR. PSRR-dc is the ratio of the change in supply voltage to the resulting change in ADC gain or offset error. It can be fraction, percentage, or log-dB of the least significant bit (LSB) (PSR = 20 &TImes; log10 (PSRR) ) to indicate that DC conditions are usually specified.
However, this method only reveals how one of the ADC's nominal parameters may vary with the supply voltage, so the stability of the converter cannot be proven. A better approach is to apply an AC signal on top of the DC power supply and then test the power supply rejection (PSRR-ac) to actively couple the signal (noise source) through the converter circuit. This approach essentially attenuates the converter and manifests itself as spurs (noise) that rises above a certain noise level beyond the noise floor of the converter. The significance is to indicate when the converter will collapse under the conditions given by the injected noise and amplitude. At the same time, this also allows the designer to understand how much power supply noise can affect the signal or be added to the signal. The PSMR affects the converter in different ways, which indicates the sensitivity of the converter to power supply noise when modulated with the applied analog input signal. This effect appears as a modulation applied to the converter near the IF frequency, which can severely damage the carrier sideband if the power supply is not designed to be rigorous.
In summary, the power supply noise should be tested and processed like any other input to the converter. The user must understand the system power supply noise, otherwise the power supply noise will increase the converter noise floor and limit the dynamic range of the entire system.
Power test
Figure 1 shows the settings for measuring the ADC PSRR on the system board. Each power supply is measured separately to better understand the dynamics of the ADC when an AC signal is applied across the power supply under test. Start with a high capacitance capacitor, such as a 100uF non-polarized electrolyte capacitor. An AC blocker that uses a 1mH inductor to act as a DC power supply is commonly referred to as a “bias-T†and can be purchased in a connector package.
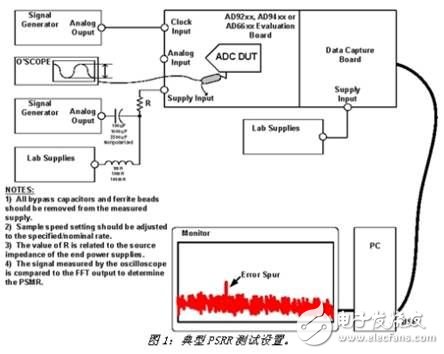
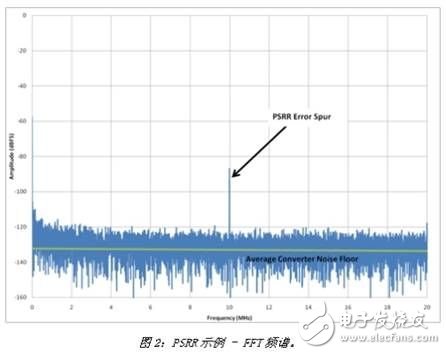
Using an oscilloscope to measure the amplitude of the ac signal, place an oscilloscope probe on the power supply pin of the ADC to be tested. For simplicity, the amount of AC signal applied to the power supply is defined as a value associated with the converter's full scale input. For example, if the ADC's full scale is 2Vpp, use 200mVpp or -20dB. Next, ground the input of the converter (without applying an analog signal) to find the error spurs at the test frequency in the noise floor/FFT spectrum, as shown in Figure 2. To calculate the PSRR, simply subtract –20dB from the error spur value shown on the FFT spectrum. For example, if the error spurs occur at -80dB of the noise floor, the PSRR is -80dB - (-20dB), or -60dB (PSRR = error spurs (dB) - oscilloscope measurements (dB)). A value of -60dB does not seem normal, but if converted to voltage, it is equivalent to 1 mV/V (or 10-60/20), which is not uncommon for the PSRR specification in any converter data sheet. .
The next step is to change the frequency and amplitude of the AC signal to determine the PSRR characteristics of the ADC in the system board. Most of the values ​​in the data sheet are typical and may only be for the worst-case or worst-case power supplies. For example, a +5 V analog power supply may be the worst compared to other power supplies. Make sure that all power features are described. If the instructions are not comprehensive, please consult the factory. This way, the designer will be able to set the appropriate design constraints for each power supply.
Keep in mind that there is a downside to testing PSRR/PSMR with LC configuration. When scanning the target band, the signal level required at the output of the waveform generator can be very high in order for the ADC supply pin to reach the desired input level. This is because the LC configuration forms a notch filter at a certain frequency that depends on the selected value. This greatly increases the ground current at the notch filter, which may enter the analog input. To solve this problem, simply swap in the new LC value when the test frequency is difficult to measure. It should also be noted here that the LC network also suffers losses under DC conditions. Remember to measure the DC power supply on the power pins of the ADC to compensate for this loss. For example, after a +5V power supply passes through the LC network, there may be only +4.8V on the system board. To compensate for this loss, simply raise the supply voltage.
The PSMR is measured in the same way as the PSRR. However, when measuring PSMR, an analog input frequency is applied to the test setup, as shown in Figure 3.
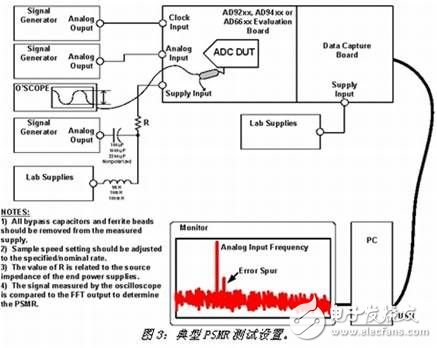
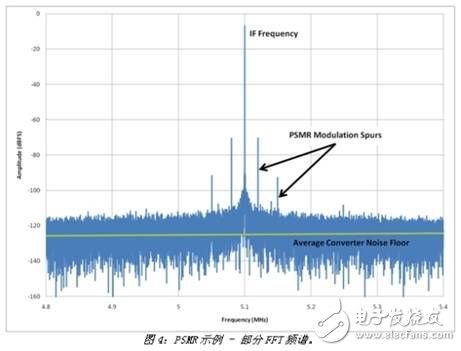
Another difference is that a modulation or error signal is applied only at low frequencies in order to observe the mixing effect of this signal with the analog input frequency applied to the converter. For this test, a 1-100 kHz frequency is typically used. As long as the error signal, ie the mixing result, can be seen around the fundamental frequency, the amplitude of the error signal can be kept relatively constant. However, it is also possible to change the amplitude of the applied modulation error signal to check to ensure that the value is constant. To achieve the final result, the difference in amplitude between the highest (worst) modulation spurs relative to the fundamental frequency will determine the PSMR specification. Figure 4 shows an example of the measured PSMR FFT spectrum.
Led Parking Light,Parking Lot Lamps,Outdoor Led Parking Lot Lights,Commercial Parking Lot Lights
Changxing Fanya Lighting Co.,Ltd , https://www.fyledlights.com